Electricity Maps smart home integration, free and open source
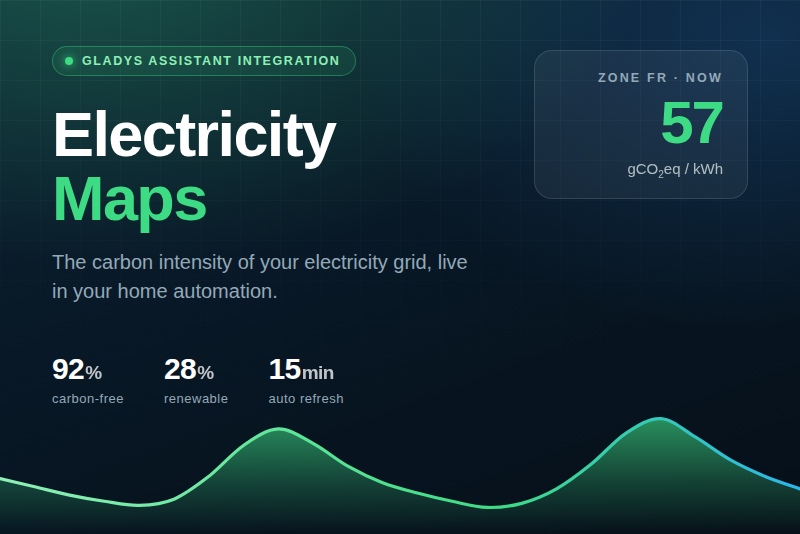
Live carbon intensity and carbon-free share of your electricity grid.
Published by prohand
- Devices
- Version 2.3.0
- Requires Gladys >=5.1.0
- ★ 0
This integration reads the carbon intensity of the electricity grid from Electricity Maps and exposes it in Gladys as sensors you can chart, and use in scenes to run your appliances when the electricity is cleanest.
It also ships a dashboard widget, a scene trigger and a scene action. It requires Gladys 5.1.0 or later.
What you get
One device, named after the zone you follow (for example
Electricity Maps (FR)), with two or three sensors depending on your plan:
| Sensor | Unit | Meaning | Free plan |
|---|---|---|---|
| Carbon intensity | gCO₂eq/kWh | Emissions of the electricity consumed in the zone right now | Yes |
| Carbon-free electricity | % | Share coming from renewables and nuclear | Yes |
| Renewable electricity | % | Share coming from renewables only | No |
They all keep their history, so they show up as charts on your dashboard. Electricity Maps serves one value per hour: a reading that brings back the hour already recorded, with the same values, is not written again (it is re-sent every 3 hours at most when nothing moves, so the sensors never look stale). The history therefore holds about one point per hour, whatever the refresh interval.
They belong to the Gladys Grid carbon sensor category: that is what gives them their name, icon and unit in the UI. If your Gladys version does not know that category yet, the integration publishes them as generic sensors instead: they then read as "Unknown", with the same values. Update Gladys to get the real labels.
The free Home Assistant key opens a single API endpoint: the one serving the carbon intensity and the fossil share (hence the carbon-free share, its complement). The renewable share comes from another endpoint, reserved to the paid plans: the integration asks it once, before publishing the device. If your plan refuses it, the "Renewable electricity" sensor is not published at all — rather than shown permanently empty — and the two others keep working. Move to a plan that serves the power breakdown and it appears on the next restart of the integration.
If you had already added the device with its three sensors, Gladys keeps the ones that exist: delete the device and add it again from the Discover tab to get rid of the empty sensor.
Get an API key
The free access is the one named Home Assistant — it is the plan for personal home automation, and it works exactly the same for Gladys.
- Create an account on the Electricity Maps portal.
- Go to Settings → Access and pick the Home Assistant tab (the other tabs, Trial and Academic, are different offers). Activate it: its free use terms are personal, non-commercial and non-revenue-generating use — which is what a home automation server does.
- Go to Settings → API keys and create your key, then copy it.
- Note the zone displayed next to your key: a free Home Assistant key
covers that single zone, and Gladys has to be told which one it is — it
names and identifies the device before the first API call. Zone
identifiers look like
FR,DE,ES,GBorUS-CAL-CISO; the full list is served by https://api.electricitymaps.com/v3/zones.
Configuration
- Open the Configuration tab of the integration.
- Paste the API key created with the Home Assistant access.
- Set the zone to follow — the same one as on your key (
FRby default). - Optionally adjust the refresh interval (900 seconds by default).
- Save, then click Test the connection: the current carbon intensity of your zone is displayed under the button.
- The device appears in the Discover tab, ready to be added. As long as the API key is not saved, the integration offers no device at all: it could only show empty sensors.
Refresh interval
The integration runs its own refresh timer at the interval you set. Electricity Maps updates its data roughly once an hour, and free plans have a monthly request quota, so there is nothing to gain from refreshing faster. The value is capped between 300 s (5 minutes) and 86 400 s (1 day), and changing it applies immediately — no restart needed, and the new interval triggers a refresh straight away. Changing the API key or the zone also triggers an immediate read.
When you add the device from the Discover tab, its sensors are filled in right away: no need to wait for the next refresh.
When Electricity Maps cannot be reached at all (typically the network not being up yet right after Gladys starts), the integration tries again after 1 minute, then after 5 minutes, instead of waiting for the next refresh; such a failure costs no request from your quota. When Electricity Maps answers "quota exceeded" with a delay to respect, nothing is read before that delay is over.
Gladys can drive the polling of a device itself, but only at a fixed set of
intervals capped at one minute: far too fast for a metered, hourly API. That is
why the devices are published without a poll_frequency.
Changing zone
The zone is part of the device identity: switching to another zone creates a new device. The old one stops being refreshed and can be deleted from Gladys.
The dashboard widget
Since Gladys 5.1 the integration adds a Grid carbon card to the widget picker of your dashboard. It shows:
- the zone you follow, the current carbon level and the hour of the value ("current hour", "previous hour", "3 h ago"): Electricity Maps serves one value per hour, so a read at 20:47 shows the value of the 20:00 hour;
- one tile per sensor (carbon intensity, carbon-free share and, if your plan serves it, renewable share), each figure coloured after what it says: the carbon intensity takes the colour of its level, the two shares go from green (70 % and above) to orange (40 % and above) and then red — the same colours as the badges of the device list;
- a chart of the carbon intensity over the last 24 hours;
- a Refresh button (reads Electricity Maps right away) and a link to the live map of your zone.
The tiles are refreshed on every Electricity Maps reading: the card is pulled again right after each poll, so the figures move at the pace of the sensors.
The chart relies on the device: until you add it from the Discover tab, the card still shows the values, without the chart, and tells you so.
What the colour costs
Gladys only colours the figure of a tile when the card carries the value itself: a tile bound to the device feature is rendered by the core's own component, which ignores the requested colour. The card therefore sends its own figures, with two consequences:
- the carbon intensity unit reads
g/kWh, notgCO₂eq/kWh: a tile unit holds 6 characters and the core truncates what overflows. The device list keeps the full unit; - the tiles no longer follow the states in real time: they are redrawn every time the card is pulled again. In practice this changes nothing — the poll loop nudges the widget right after each reading, which is exactly when a figure changes.
Finally, the colour tints the text of the figure; it does not draw a filled pill like the device list. The widget vocabulary has no badge on a tile.
The carbon level
The carbon intensity is a number; the level is its reading on five bands, used by the widget and by the scene trigger:
| Level | Carbon intensity |
|---|---|
| Very low | < 100 gCO₂eq/kWh |
| Low | 100 – 200 gCO₂eq/kWh |
| Moderate | 200 – 400 gCO₂eq/kWh |
| High | 400 – 600 gCO₂eq/kWh |
| Very high | ≥ 600 gCO₂eq/kWh |
The bands are fixed and the same for every zone: a scene means the same thing from one week to the next. A margin of 10 gCO₂eq/kWh keeps a value sitting on a boundary from changing the level on every reading.
Scene trigger
In the scene editor, under the Integrations category:
"Grid carbon level changed" — runs when your zone moves from one band to another. You can filter:
- on the new level (for example only "Very low" and "Low");
- on the direction (the grid got cleaner, or got dirtier).
Leave a filter empty to react to every case.
It fires once per change, not on every refresh, and never on the first reading after a restart (nothing changed, the integration just started looking).
The scene can reuse the values of the event: {{triggerEvent.data.level}},
previous_level, direction, zone, carbon_intensity,
carbon_free_percentage, renewable_percentage.
For a plain threshold ("when the intensity drops below 80"), use the standard Gladys trigger on the sensor value: that is what it is for. The integration's trigger is about the band change, which Gladys cannot express on its own.
Scene action
"Get the grid carbon data" — makes the values of your zone available to the
following actions of the scene: zone, level, carbon_intensity,
carbon_free_percentage, renewable_percentage and age_seconds (the age of
the reading, in seconds).
A "Read Electricity Maps first" checkbox, off by default, forces a live read. Leave it off in most cases: the data only moves about once an hour, and free plans have a monthly request quota. When that live read fails, the action fails too, rather than handing over the previous values as fresh ones. The same goes for the widget's Refresh button.
Ideas of scenes
- Start the dishwasher or charge the car when the carbon level reaches "Very low" or "Low" (the integration's trigger).
- Start the dishwasher or charge the car when the carbon intensity drops below a threshold you choose (the standard trigger on the sensor).
- Send yourself a notification when the carbon-free share goes above 90 %.
- Send a message carrying the current intensity: the Get the grid carbon
data action, then a notification using
carbon_intensity. - Chart your own consumption next to the grid intensity to see the CO₂ cost of your habits.
Troubleshooting
| Message | What to do |
|---|---|
Invalid API token ... (HTTP 401) | Token mis-copied, or a zone different from the one on your key |
Zone ... not allowed (HTTP 403) | Your plan does not cover this zone — use your home zone |
Unknown zone (HTTP 404) | Check the identifier against the list of zones |
quota exceeded (HTTP 429) | Increase the refresh interval, or wait for the quota to reset |
Electricity Maps unreachable | Network or DNS problem on the Gladys host |
The value differs from the Electricity Maps site
That is expected, the two do not show the same thing:
- The integration reads one value per hour. A free key can only call
/v3/home-assistant, which serves the value of the current hour (often an estimate). - The site draws 5 or 15-minute points, flagged "Preliminary". When the intensity moves fast, a 22:45 point can be far from the hourly value.
- The data is revised afterwards. Estimated then preliminary values get corrected by Electricity Maps over the following hours.
To compare, use the same hour: the logs give the hour of the value read
(Carbon intensity: 66 gCO₂eq/kWh (hourly value of 2026-09-22T20:00:00.000Z),
UTC time), and switch the site to the hourly granularity.
The sensors still read "Unknown"
Two possible causes:
- Your Gladys does not know the category yet. The integration logs say so
(
does not know the grid carbon sensors yet): update Gladys, then do step 2. - The device was created before. Gladys never rewrites the feature
categories of an already-created device: delete the
Electricity Maps (...)device in the integration's Devices tab, then add it again from its Discover tab. The old device's history is lost, the values start over.
The integration logs everything it does: check the integration logs from the
Gladys UI (or docker logs on the host) with LOG_LEVEL=debug for the full
detail.
Some zones do not publish data at every hour. When that happens the missing
value is simply skipped for that round, instead of being written as a bogus
0.
The free plan is limited to one zone and 50 requests per hour: at the default interval (900 s) the integration uses 4 of them per hour.
Configuration settings
These are the settings Electricity Maps asks for in its configuration screen in Gladys.
| Setting | Type | Required | Description |
|---|---|---|---|
| Getting started | section | No | Electricity Maps publishes the carbon intensity of electricity grids worldwide. Create a free account on the portal, then in Settings > Access activate the "Home Assistant" plan: it is the free, personal and non-commercial one (Trial and Academic are the other tabs). Create your key in Settings > API keys, paste it below, then set the zone you want to follow (for example FR, DE or US-CAL-CISO). A free key covers ONE zone: use the zone shown next to it, or every request answers 401. The free plan serves the carbon intensity and the carbon-free share; the renewable share needs a paid plan and stays empty otherwise. |
| API token | secret | Yes | API key created in the portal under the free "Home Assistant" access. |
| Zone | string | Yes | Identifier of the grid zone to follow, e.g. FR, DE, US-CAL-CISO. Copy the zone shown next to your key in the portal: a free Home Assistant key only covers that one. |
| Refresh interval (s) | number | No | How often the zone is polled, in seconds. Electricity Maps refreshes about once an hour and free plans have a monthly request quota: 900 s is a good balance. |
How to install Electricity Maps in Gladys
- In Gladys, open Integrations: Electricity Maps appears in the catalog, next to the native integrations, with a community badge.
- Click Install. Gladys pulls the Docker image (
ghcr.io/prohand/gladys-electricity-maps:2.3.0), starts it in a sandbox isolated from the core, and generates the integration's interface (devices, discovery and configuration). - Open the Configuration screen of the integration, fill in the settings, and save.
- You can also install it directly from its repository URL: https://github.com/prohand/gladys-electricity-maps.
Electricity Maps requires Gladys >=5.1.0. The catalog inside Gladys refreshes every hour, so a new version becomes available at most one hour after its release.
Not running Gladys yet? It is free and open source: follow the installation guide to get started.
About external integrations
Electricity Maps is an external integration: a community integration packaged as a Docker container and published on GitHub, that Gladys installs in one click and runs in a sandbox isolated from its core. It is published and maintained by prohand, not by the Gladys core team.
- Browse all integrations, native and community
- Build and publish your own external integration
- Source code on GitHub — source of this documentation